
Inflation and a Likely Recession; the Return of the Old Maladie
The Blog Papers of Dr.
Michael Sakbani; Economics, Finance and Politics
Dr.
Michael Sakbani is a professor of economics and Finance at the Geneva campus of
Webster-Europe. He is a senior international consultant to the UN system,
European Union and Swiss banks. His career began at the State university of NY
at Stoney Brook, then the Federal Reserve Bank of New York followed by UNCTAD
where he was Director of the divisions of Economic Cooperation,
Poverty Alleviation, and UNCTAD`s Special Programs. Published over 125
professional papersand coaurhored 6 books. The Intelligent Economist selected Dr. Sakbani`s blog michaelsakbani.blogspot.com
as one of the top 100 blogs in the world in 2020, and 2022.
- Getting Peace in Time of Peril
- A Plan For Ending the War in Ukraine
- Prleliminary oulineof a ukraine
solutionByDr. mic...
- Why did the Syrian Revolution Fail
- Democracy in the USA; a critical evaluation
- The Middle East and the New Sham
Project; Fantaci...
- President Biden`s Fiscal Policies In The
US`Curren...
- Post - Trump America: A Clarion Call For
Reconstru...
- The 2020 Elections In The Collimator;; What
Did Th...
- President Trump and a Possible Biden`s Victory
in ...
SATURDAY, NOVEMBER 12, 2022
Inflation
and a Likely Recession; the Return of an Old Malady
Inflation and
a Likely Recession ; the Return of an Old Malady
by
Dr. Michael Sakbani
The things we
forgot
Over the past
four decades, the world has forgotten about the old malady: inflation. That is
because China and other developing countries learned how to export and attract
developed country profit- seeking enterprises to locate therein in order
to produce products at lower costs. The advantage of low cost was due to
cheap labor as well as escaping international labor, environmental and
public-health standards. This great transfer of jobs built an efficient global
supply- chain. It brought down consumer prices, vastly increased company
profits, created international economic dependence and equally plighted many
old industrial areas in the US and Europe. The globalization of supply escaped
national state control and the resultant uncontrolled international business
greatly favored globalization participants and markedly contributed to severe
income inequalities. This was globalization as we experienced it for the three
decades since the nineties.
The
industrial globalization was also followed by a similar financial globalization
which brought to the whole world the recession of 2008. The public treasuries
paid out billions to save the financial system which caused the recession. And
ironically, the financial system rewarded the guilty doers who scandalously
escaped any accountability when it5 got iots hands on the public monery.
In this
apparent, but surface well-being, Central Banks did very well their job of keeping the economies growing but hardly thought about the impact of
their quantitative expansion on their job of guarding against future inflation.
And when the time came to act, they acted late, but with vengeance.
In 2019, the
world was hit by COVID, an extraordinary global epidemy. Nobody seemed to have
been well-prepared for this global event. In the world leading economies:
the USA and China, the reaction differed. In China the remedy was a
lock-down to achieve zero covid and in the US, President Trump was more
interested in his reelection than in combatting the epidemy. The global
aggregate supply and demand were simultaneously destroyed and a far reaching
slump took hold with massive labor furloughs and pent- up demand, especially
for services.
At the end of
2020 and throughout 2021, global expansionary fiscal policies were vigorously
pursued with accommodative monetary policies in almost all the developed
economies. These policies protected the economic well-being of the public,
saved many jobs from disappearing and kept small and medium businesses out of
bankruptcy. In 2022, most economies were recovering from the devastation of
COVID 2019. But the recovery was asymmetrical, being largely on the aggregate
demand side, while the aggregate supply side was hampered by supply-chain
dislocations. Theser included China`s zero-covid policy, bottlenecks in the structure
of supply chain as well as shifts in planned business investments.
All of that resulted in a skewed recovery: recovery in aggregate demand but
a hampered one in aggregate supply.
Adding to
this, President Putin unclenched in February 2022 his attack on Ukraine. The US
lead the West in imposing draconian all-encompassing sanctions on the Russian
economy to cut its exports. So far, the
sanctions have resulted in harming the
Western economies and increasing President Putin oil and gas revenuesby more
than $100 billion despite a 20 percent
reduction in his sales of oil and gas. The war shot- off also 30 percent
of the global supply of wheat and fertilizers and the bulk of Russia `s supply
of gas and oil to Western Europe.
Inflation: a
Statistical Picture:
Figure one USA

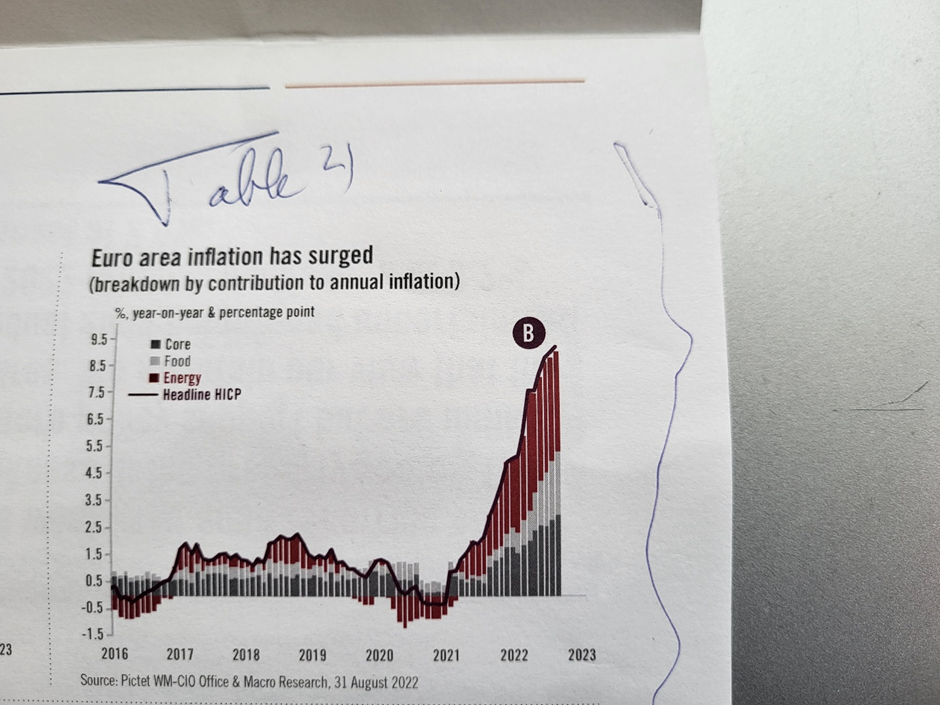
Figure two
Euro- area inflation
 Figure
three
Figure
three
Global Inflation

Second, the
composition of inflation is wide ranging covering, energy, transportation
costs, food, fertilizers, consumer credit, borrowing cost and housing mortgage
rates. Thus, it is quite comprehensive and by the consequent interactions is
self- sustaining.
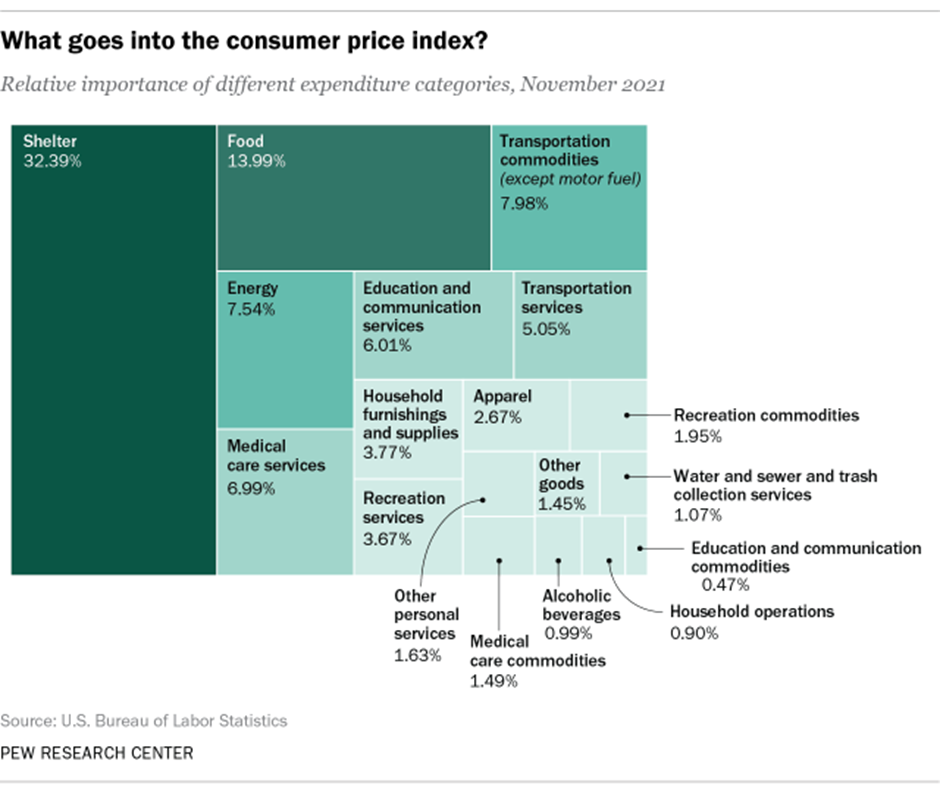
Table 1
Composition of inflation
PEW RESEARCH CENTERJANUARY 21, 2022
What goes into the consumer price index?
Third, many developing countries face physical shortages in aggregate supply, while developed countries face, on the whole, bottlenecks in the aggregate supply.
Fourth, the prices of the major components of inflation; namely, food, energy and fertilizers are determined in the international market and not in the local markets. Hence, international traders such as the oil companies stand to reap windful profits, quite unearned by their local operations, because of this off-limits revaluation of their inventories. Indeed, the data in table 2 show historical records of profits of all US`oil and energy companies.
Table 2
The
windful profits US oil companies
Oil company profits: Net income (excluding exceptionals) $bnJan - Sep 2021
Jan - Sep 2022
reported
Forecast
$0bn
10
20
30
40
Shell
$12.8bn
$30.1bn
BP
8.7
20.7
ExxonMobil
14.3
42.7
Chevron
10.7
27.3
TotalEnergies
11.3
28.7
Eni
2.6
10.3
ConocoPhillips
5
13.8
Guardian graphic.
Source: S&P
Global Market Intelligence; Guardian Analysis
Inflation
Causes; Real and Financial
There are
real and financial causes for the present inflation. The real factors are
headed by the Covid 19 epidemy, which wiped out aggregate supply from
February 2020 till the wide roll- out of the vaccines in the spring of 2021,
close to 16 months of large-scale closures. This destruction of aggregate
supply was global. Hence, the global supply- chain which has been built and
widely scattered in the heydays of globalization was very affected. China,
which accounts for about one fourth of world exports and dominated the supply-
chain pursued a policy of zero covid which meant continued closure of its
productive factories when the Western economies were beginning to recover.
To this list
of aggregate supply problems, President Putin added an ace: he unclenched in
February 2022, his attack on Ukraine. The war and the Western
unified reaction to it, resulted in severe energy shortages, especially
in Europe; oil prices nearly doubled and gas prices increased four folds.
The situation is dissimilar in the US, because while the country is
self-sufficient in energy supply, it is deficient in refining capacity. The US
energy companies using off-limit international pricing did not cap their prices and reaped the huge
windful profits shown in table 2.
It should be recalled that Russia and Ukraine are in the top five global exporters of food, commodities and fertilizers.,The two of them account for 30 percent of wheat exports. Ukrain, by itsself has 10 % of the world market in wheat, 15 % of corn and 13% of barley (Eisele/DW)[i]The interruption of these exports caused price increases everywhere. This price escalation masked the significant decline in global commodity prices in 2022.
The financial
causes were precisely the vigorous fiscal policies pursued by all countries and
the accommodative monetary policies accompanying them. In the USA, fiscal
measures during President Trump`s term and the first two years of
President Biden added $ 5.5 trillion to planned expenditures over several
years. About half of that was pumped into circulation over two and a half
years; a massive and unprecedented monetary stimulus.
President
Biden`s budget stipulated raising taxes to finance one third of his
expenditures, and assumed a growth scenario of the economy, and thus of tax
revenues, to finance a second third. In reality however, the proposed tax
increases failed to pass the US` Senate and the supply problems did not allow
the forecast growth in revenues. Hence, the excess supply of money was not
about $800 billion , rather the entire amount pumped in in the last two
years, i.e. three timesas much.
And to this lBiden`s iquidity injection, Mr. Trump`s administration had cut taxes on the wealthy and corporations on the unsupported assumption that there would be a trickle down expansion of investment. There was no such trickle down and the result was an increase in the wealth of the rich and a massive buying of own equity by the corporations. In sum, the two administrations, for entirely different reasons, injected billions into the circulation. This caused inflation at rates we have not seen in forty years. Moreover, the resultant increases in the cost of living will hit all the households and will not be alleviated by Central Banks` actions even if inflation returns to the range of 2-3 percent.
The Evolution
of Inflation in the US, Japan and Europe
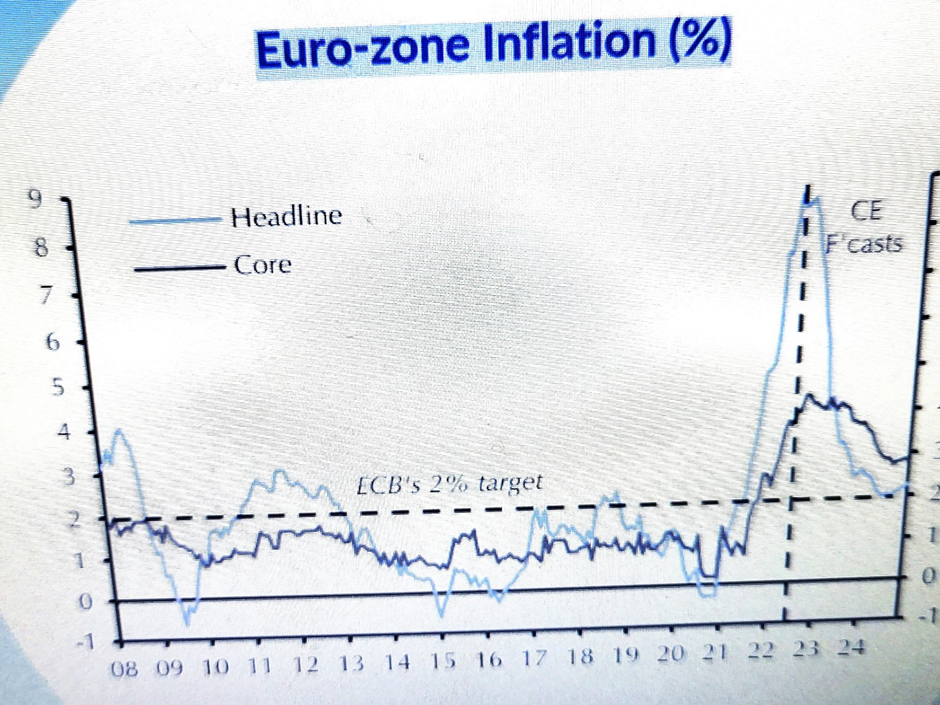
figure 4
Diagram of US inflation pace
figure 4 shows that the US` CPI (consumer price index) attained the highest level in the past forty years. It rose from 2.2 percent in 2016 to 9.2 percent last August. Thereafter it has declined in September and October to 8.6 percent. The forecast is for a more slow decline in the months ahead. The most notable inflationary parts of the CPI basket are food, borrowing cost, and mortgage rates. Energy prices have declined for several months through September and have levelled off thereafter.
In the Euro area, the picture as shown in figure 5 is even worse. Inflation has risen from virtually zero in 2016 to 9.5 in October 2022 and a consensus forecast of 10 percent early in 2023. Energy remains the biggest contributors to the index` basket.
Figure Five
EU inflation pace
The UK
provides the grimmest picture with inflation climbing to 11.1 in November 2022
from 10.1 in October. Both food and energy are the biggest contributors. it is
now officially recognized that the UK economy is already in recession (Pictet
Banque, September 2022, )[ii]
Japan is an
outlier in that its inflation rate went up from - 0 .4 percent in 2012 to 2.9
percent in September 2022 (Ibid,) [iii].
The US
‘Policy Response and the likely Recession
The US
‘policy response is in many ways similar to the policy responses of other
developed economies, with the possible exception of the UK. It stays its hands
on fiscal policy but assigns to monetary policy the task of wrenching out inflation.
Monetary
policy impacts directly aggregate demand with a lag of that extends to 9 months. It
affects aggregate supply only indirectly and after a more extended lag.
The US` Federal Reserve has so far raised its rate by four points in less than
a year. The question raised by financial commentators is whether the Fed will
refrain from further hikes once it reaches a plateau of 4.5 percent, which it
is expected to attain by the end of this year. A quantum jump of interest rate of 400 paces- points
has historically brought down recession.
The US
economy still faces a strong labor market with unemployment around 3.6
percent. the Biden Administration has added 10 million jobs to employment
through October 2022 and is expected to add more in November. This level of
unemployment is historically full employment. However, there are more job
offers than job seekers. Three factors might shed some light on this riddle. The participation of able white workers in the active labor force has declined in the
last three decades. Nobody has come up with a satisfactory explanation of that.
The second factor is the difficulties President Trump put on students and
foreign workers visas and immigration which has affected the Tech. Sector
in particular. The third factor is the decline in female participation in
active job seeking. Female participation rate has declined since the onslaught
of COVID 19. This is the case in minority female workers and low paying jobs
laborers. It is perhaps not surprising that the lack of public support in the
US for children care of working mothers is responsible for that.
This muddy and somewhat complex picture poses
difficulties for monetary policy making. The other major difficulty is
that aggregate supply is somewhat missing in this policy picture. There is
evidence that the supply-chain problem is easing. But China`s zero Covid policy
is still keeping China`s factories away from supplying the required accessories
and intermediate products.
Thus, the Fed
will have to continue pressing down aggregate demand to a level well below the
economy`s capacity in order to equal aggregate supply. This is indeed a
harbinger of recession in 2023. In this respect however, there are several
factors that should moderate the Fed`s action. The first one is the decline in
inflation pace shown in the figures above. It can be reasonably predicted that by mid-december the CPI would be around 7 percent and core iinflation bellow 5 percent. The second is the decline in
employment shown in the most recent data exhibited in table three bellow.
Table Three
US` Employment
Statistics
Employment Rate in the United States
decreased to 59.90 percent in November from 60 percent in October of
2022.
source: U.S. Bureau of Labor Statistics
|
Related |
Last |
Previous |
Unit |
Reference |
|
3.70 |
3.70 |
Percent |
Nov 2022 |
|
|
263.00 |
284.00 |
Thousand |
Nov 2022 |
|
|
158470.00 |
158608.00 |
Thousand |
Nov 2022 |
|
|
0.60 |
0.50 |
Percent |
Nov 2022 |
|
|
62.10 |
62.20 |
Percent |
Nov 2022 |
|
|
10334.00 |
10687.00 |
Thousand |
Oct 2022 |
|
|
1.20 |
1.30 |
Percent |
Sep 2022 |
|
|
59.90 |
60.00 |
Percent |
Nov 2022 |
|
|
26394.00 |
26230.00 |
Thousand |
Oct 2022 |
|
|
132228.00 |
132661.00 |
Thousand |
Oct 2022 |
---------------------------------------------------------
United States
Employment Rate
In United States, the employment rate measures the number of people who
have a job as a percentage of the working age population.
|
Actual |
Previous |
Highest |
Lowest |
Dates |
Unit |
Frequency |
||
|
59.90 |
60.00 |
64.70 |
51.30 |
1948 – 2022 |
Percent |
Monthly |
SA |
The third factor is the decline in aggregate demand.
There are many signs of that. One such an
indicator is the decline in business investment orders, a leading indicator.
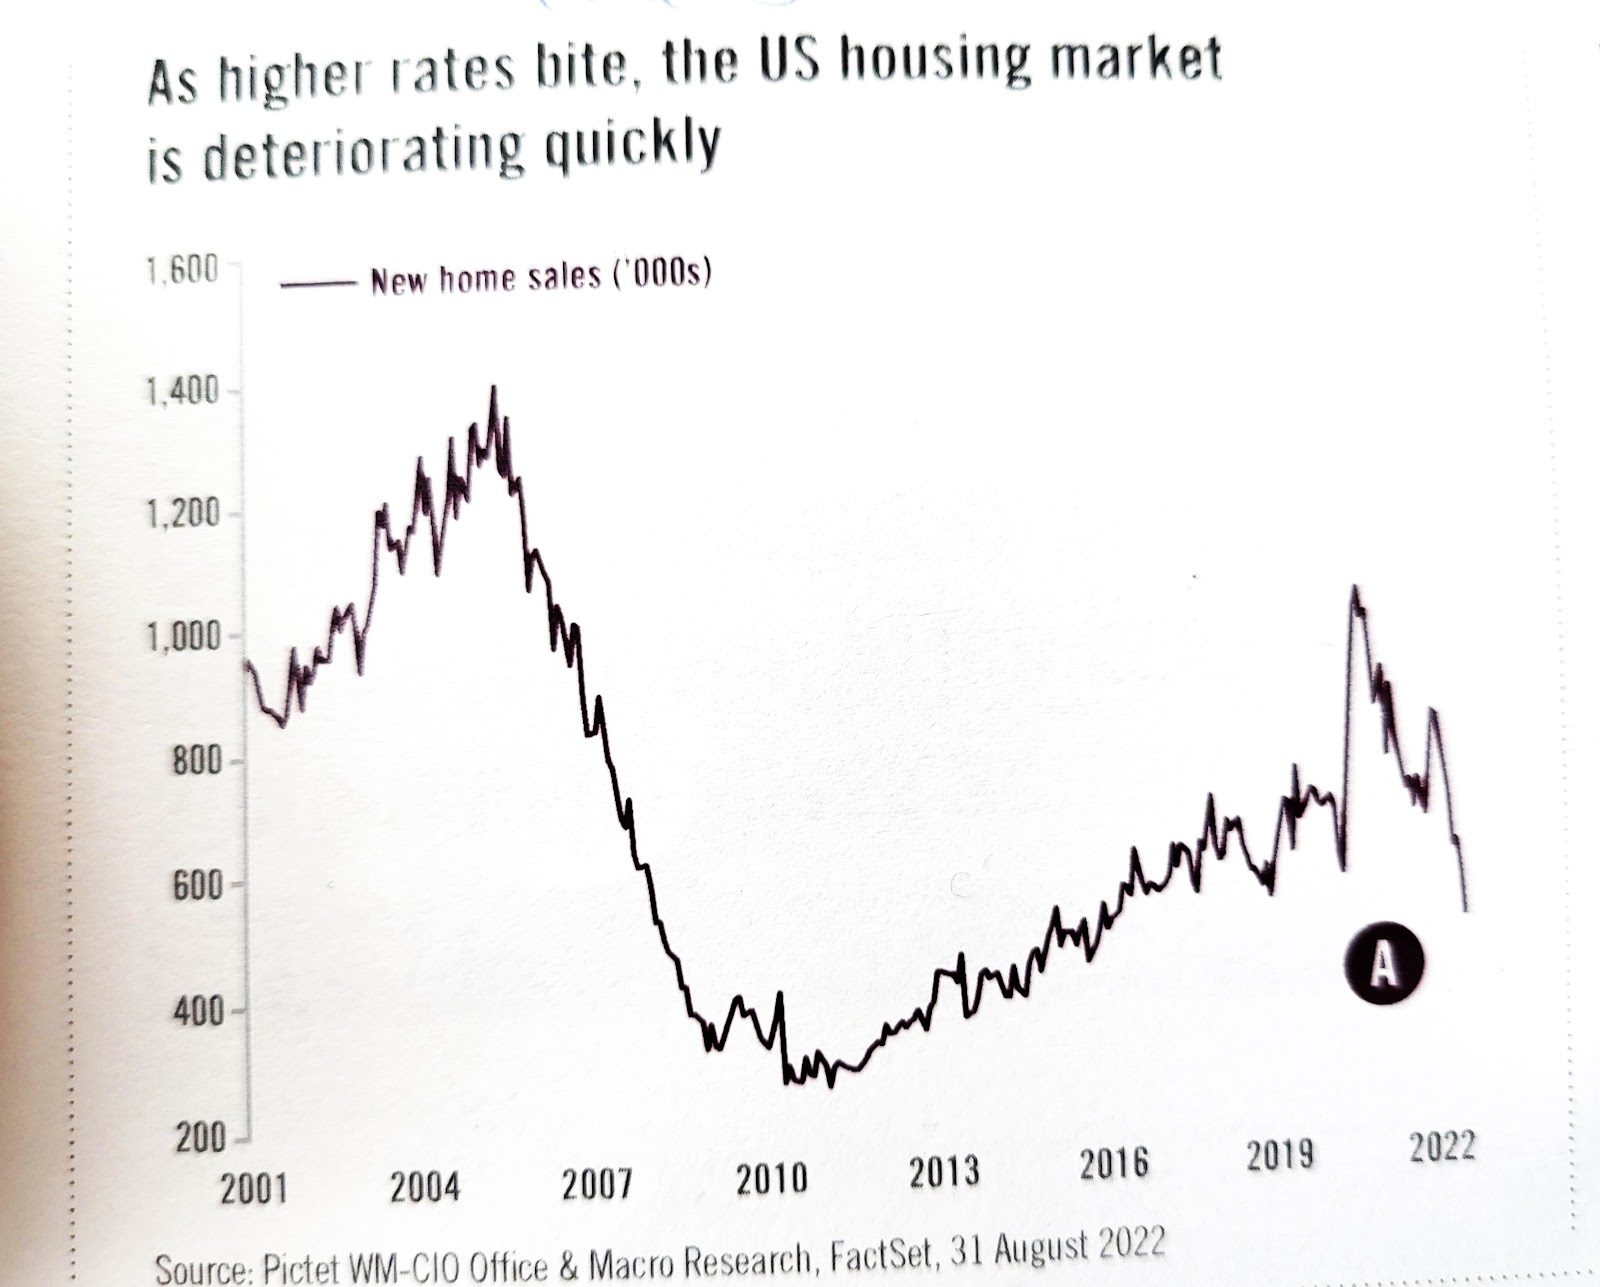
The other one is the steep decline in new housing construction.Figure six bellow documents
this factor
Figure Six
Decline in New Housing Starts
The University of Michigan Survey
points to recession expectations of consumers. Moreover, job creation is
beginning to dip because real wages which were positive till March 2022 have turned negative thereafter. However, these three
factors are counteracted by the stickiness of consumer expectation shown in
figure seven bellow
Figure Seven
Stickiness of Consumer Expectation
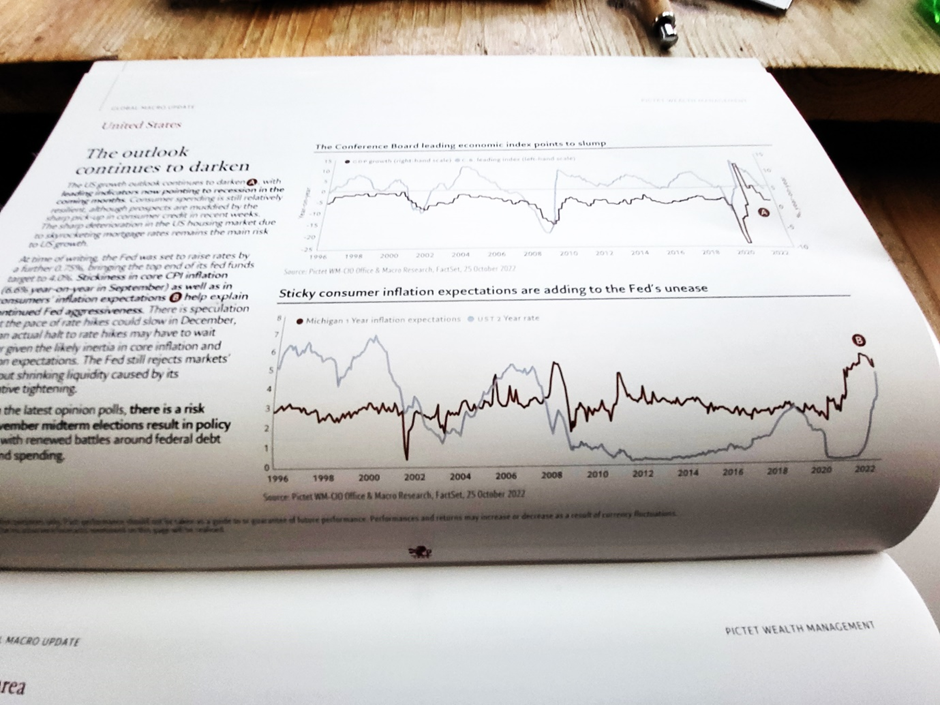
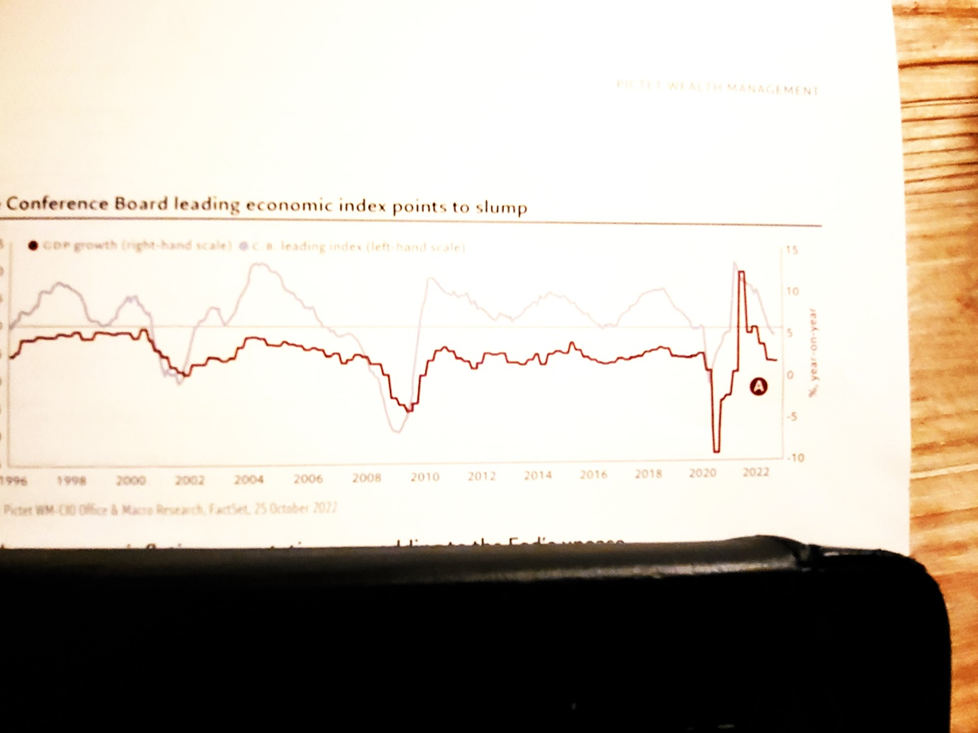
Nonetheless, the Conference Board tracking several leading indicators has concluded that the US will dip into a mild recession in 2023 (Author`s note)[iv].
Figure Eight
Conference Board Leading indicators
Geneva (Octobe2022)
Notes
[1] Ines Isele in DW, 11/1/2022
[ii]According to Bank Pictet WM CIO
Office & Macro Research, , fact set, September 29, 2022, the UK inflation rate of the CPI went up from
2 percent in 2002 to 11 percent. The
core inflation rate went up from 2 percent to 6.5 percent.
[iii] Pictet Bank OP. Cit.
[iv] The Peter Peterson Institute estimated that
the US Administration can shave off 1 percent of the CPI inflation rate by
cancelling President Trump import duties on China. President Biden indicated
that this step is under consideration.
Furthermore, the Inflation Control
Act of 2022, would cut off over 2023 the cost of drugs and health
care support by another 1 percent.
The US Bureau of Labor Statistics reported that US`
employment increased in November 2022 by 265 thousand,a figure
signinficantly larger than what was expected. Therefore, it looks that the US labor market
is still strong and the US economy might avoid a severe recession if the
Federal Reserve moderates its stance in light of all the data marshalled above..
posted by Dr. Michael Sakbani | 12:38 AM
0 Comments:
posted by Dr. Michael Sakbani | 12:38 AM
|
0 comments
![]()
![]()